
Three money questions, not one
There is a big dollar amount on the dashboard. Everyone likes that part. Then a client asks whether that is money they have made, money they might make, or money that has actually arrived. Suddenly the label matters a lot more than the size of the number.
GoHighLevel pipeline value, won opportunity value, and payments collected answer different questions. Treating them as interchangeable is an easy way to have a confusing reporting call, even when every number on the screen is technically correct.
Let’s separate them using Creative Pop and the flagship Agency Dash Pro Dashboard. All screenshots use preview data. They illustrate different reporting views, not a customer case study, a forecast, or one group of deals moving through a sales cycle.
Open pipeline value is business still in play
Open pipeline value is the value recorded against the open opportunities included in a report. HighLevel’s opportunity widget reference defines Opened Opportunity Value as the combined monetary value of open opportunities. Total Opportunity Value is a different metric: it includes opportunities regardless of status.
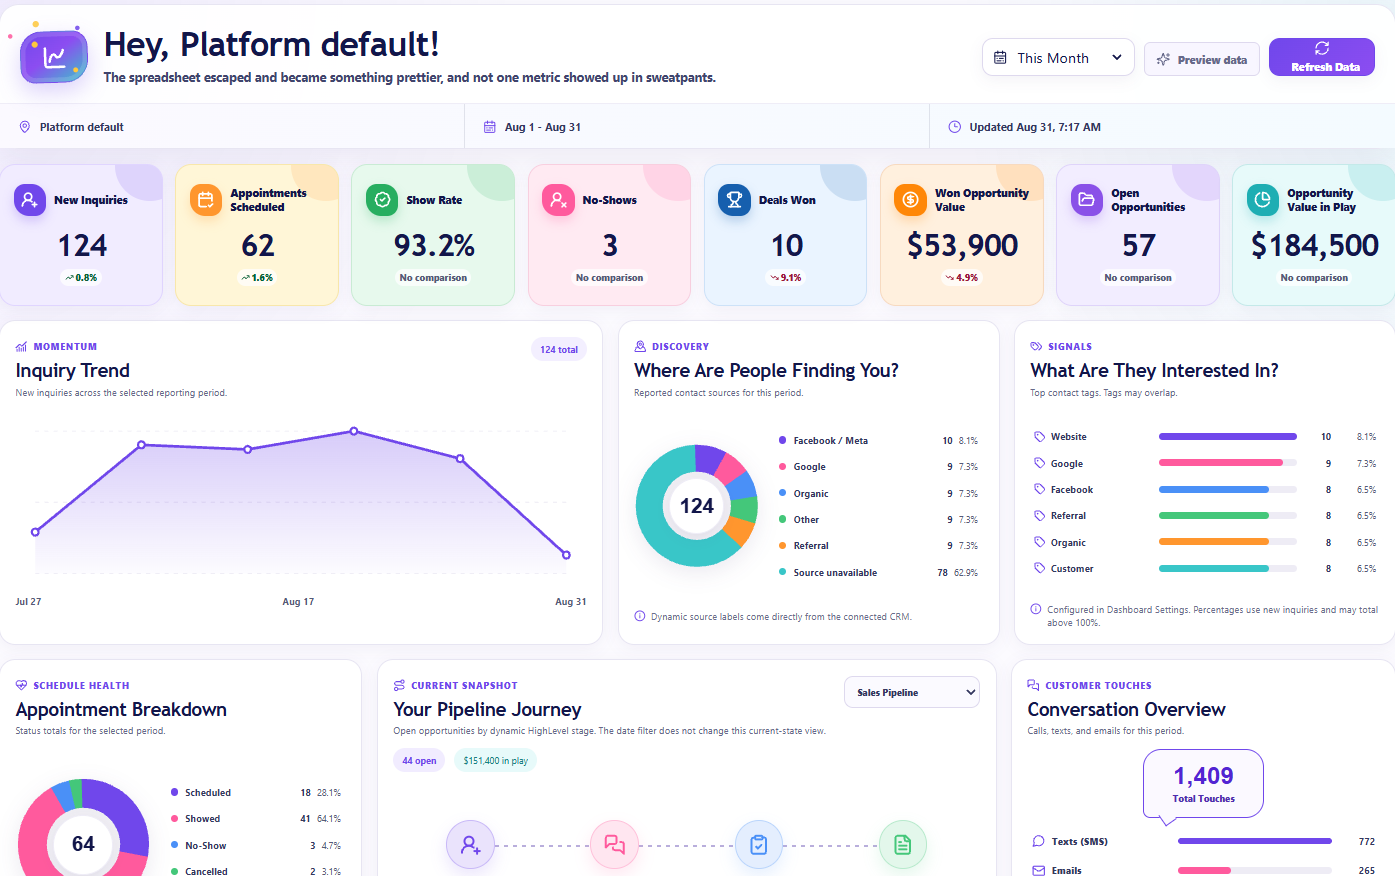
In the Creative Pop preview below, Open Opportunities shows 57 and Opportunity Value in Play shows $184,500. Those labels help keep two questions separate: how many opportunities are in play, and what value is attached to them? Neither card says those deals have closed.
The useful follow-up is not simply whether the total is bigger than last month. Ask which deals are still active, whether their values are realistic, and whether there is a clear next step. An untouched opportunity can keep making the pipeline look healthy long after the conversation has gone quiet.
And do not turn the full pipeline total into a promise of next month’s income. A list of possible deals is not a forecast unless you have defined and validated the forecasting method behind it.
Won opportunity value tells a different story
Won opportunity value adds up the recorded amounts on the won opportunities included in that view. It is a sales result in the CRM. It does not automatically prove that an invoice was paid or that the amount has been recognized in the company’s accounts.
Creative Pop makes the wording explicit: Deals Won sits beside Won Opportunity Value. In this preview, those cards show ten and $53,900. You get the number of wins and their recorded value without asking one lonely dollar figure to explain everything.
Some layouts use a label such as Won Revenue. When that card is based on opportunity records, explain it in those terms. A different label does not turn the underlying opportunity amount into verified payment data.
Keep the count alongside the value. More wins with a lower total can mean smaller deals, but it can also mean missing or inconsistent amounts. Check the records before turning a pattern into a conclusion about the sales team.
For money collected, look at payment records
Here is a made-up example, separate from the screenshots: a business wins a $6,000 project and receives a $1,200 deposit. The won opportunity can carry $6,000 while the amount paid so far is $1,200. Those totals are different because they are answering different questions, not because one screen must be broken.
HighLevel has separate payment reporting. Its Payments Widget guide describes collected-revenue, successful-payment, invoice-paid, and refund views. If the question is what was actually paid, use the relevant payment records and confirm the report’s treatment of refunds and its reporting period.
Also check where the business takes payments. A report can only reflect the payment data available to that reporting setup. Do not assume a CRM opportunity card includes a payment taken somewhere else, or that changing a sales status proves a payment succeeded.
Profit is another question again. Neither an open pipeline amount nor a won opportunity total tells you what it cost to deliver the work.
Match the date question before comparing totals
Match status, period, and date field before comparing two views. HighLevel’s opportunity widgets support Created On, Updated On, and Status Change. A deal created in October and won in November can belong to different periods.
Status Change reflects the latest change, not a permanent date for a past outcome. Reopening a record can alter it. Check the actual reporting definition before treating a historical total as frozen.
Ask whether you need deals created during the month that are now won, deals that became won during the month, or a snapshot of what is open now. Those are three different reporting questions.
Look behind the total at the pipeline stages
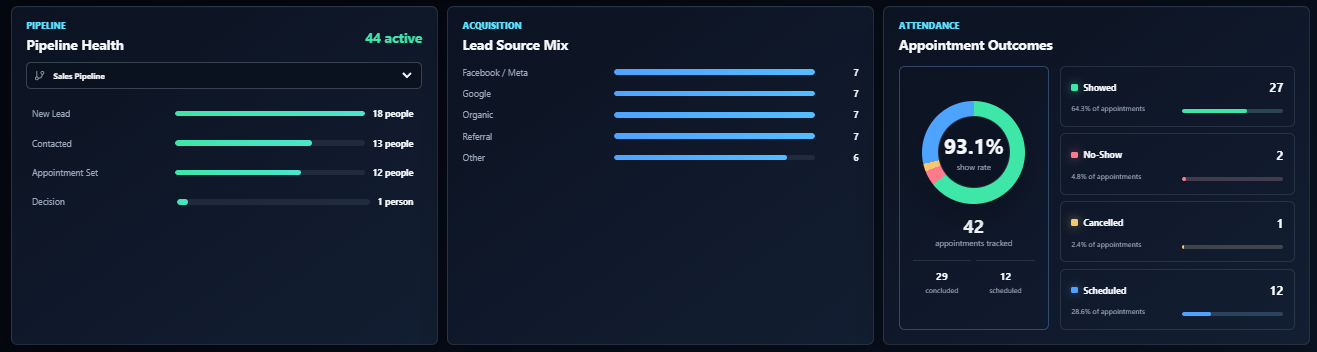
A headline amount tells you the scale of the pipeline. A stage view helps you see where the work is sitting. In this flagship preview, Pipeline Health shows New Lead, Contacted, Appointment Set, and Decision under the selected Sales Pipeline.
That gives you somewhere useful to start a conversation. Are opportunities mostly near the beginning? Is anything waiting on a decision? Which records need a real next action? Inspect the underlying opportunities before deciding there is a bottleneck; stage names alone do not tell you how long a deal has been there.
This stage screenshot is a separate preview view, so do not reconcile its 44 active opportunities with the 57 shown in Creative Pop above. In a live account, match the pipeline, filters, and reporting scope before expecting two panels to agree.
Agree on what belongs in an opportunity amount
The dashboard cannot choose your value convention for you. If one person records a monthly fee and another records a full contract amount for the same kind of sale, the sum is hard to interpret even if the report adds it up perfectly.
Agree on what the opportunity amount represents for each reporting group. Also review missing values, extra zeros, duplicate opportunities, and records left open after the deal was lost. Use different reporting segments where values are not meaningfully comparable, and do not add unrelated currencies together as though they were one unit.
Fix records through your normal authorized process, not by marking everything won or deleting awkward opportunities to make the chart look better. A useful reporting screen should make data-quality questions easier to spot, not give you a reason to hide them.
Give clients a plain-English explanation
A useful explanation can be short: this is the recorded value of the open opportunities in this view; this is the value attached to the won opportunities; payment reporting tells us what has actually been collected. Then state the period and any important scope differences.
That is where a clear client reporting dashboard earns its place. Agency Dash Pro brings the supported reporting panels into a curated view inside HighLevel. It makes those questions easier to find and discuss; it does not turn opportunity records into an accounting system.
For the wider reporting picture, our guide to seven client dashboard metrics covers how wins and pipeline fit alongside leads, appointments, and follow-up activity.
The goal is not to make the biggest number the hero of every check-in. It is to help the client understand what is still possible, what has been won, and what has been paid. Three clear answers beat one impressive-looking number with a very long explanation.