A colorful chart still needs an explanation
Where are our leads coming from? It sounds like a five-second question. Then someone points at Facebook in one report, Meta in another, and a mysterious Other slice that seems to be doing a lot of heavy lifting.
GoHighLevel lead source reporting gets much easier when you stop treating every source-looking label as the same thing. Contact Source, attribution, and contact tags can each be useful. They just do not necessarily answer the same question.
Let’s use Creative Pop to put some of those differences on screen. Every screenshot below uses preview data, not a customer’s results. We are looking at how to read the dashboard, not declaring a winning marketing channel.
Contact Source is not the whole attribution story
Contact Source is a stored label on the contact. HighLevel’s Source field guide explains that forms and surveys can assign a predefined value. It also makes an important distinction: that Source value is separate from First Attribution, Latest Attribution, Session Source, and utm_source.
Attribution describes recorded marketing touchpoints. First Attribution looks at the first recorded touchpoint; Latest Attribution looks at the most recent one. HighLevel’s attribution filter guide explains how supported Contact and Opportunity widgets use those choices and captured UTM fields.
Imagine someone first finds a business through a search ad, comes back through an email, and then books. That is an illustrative journey, not a customer example. Asking what first brought them in is different from asking about their latest recorded interaction. A single contact label cannot explain the whole journey on its own.
Read the missing slice before picking a winner
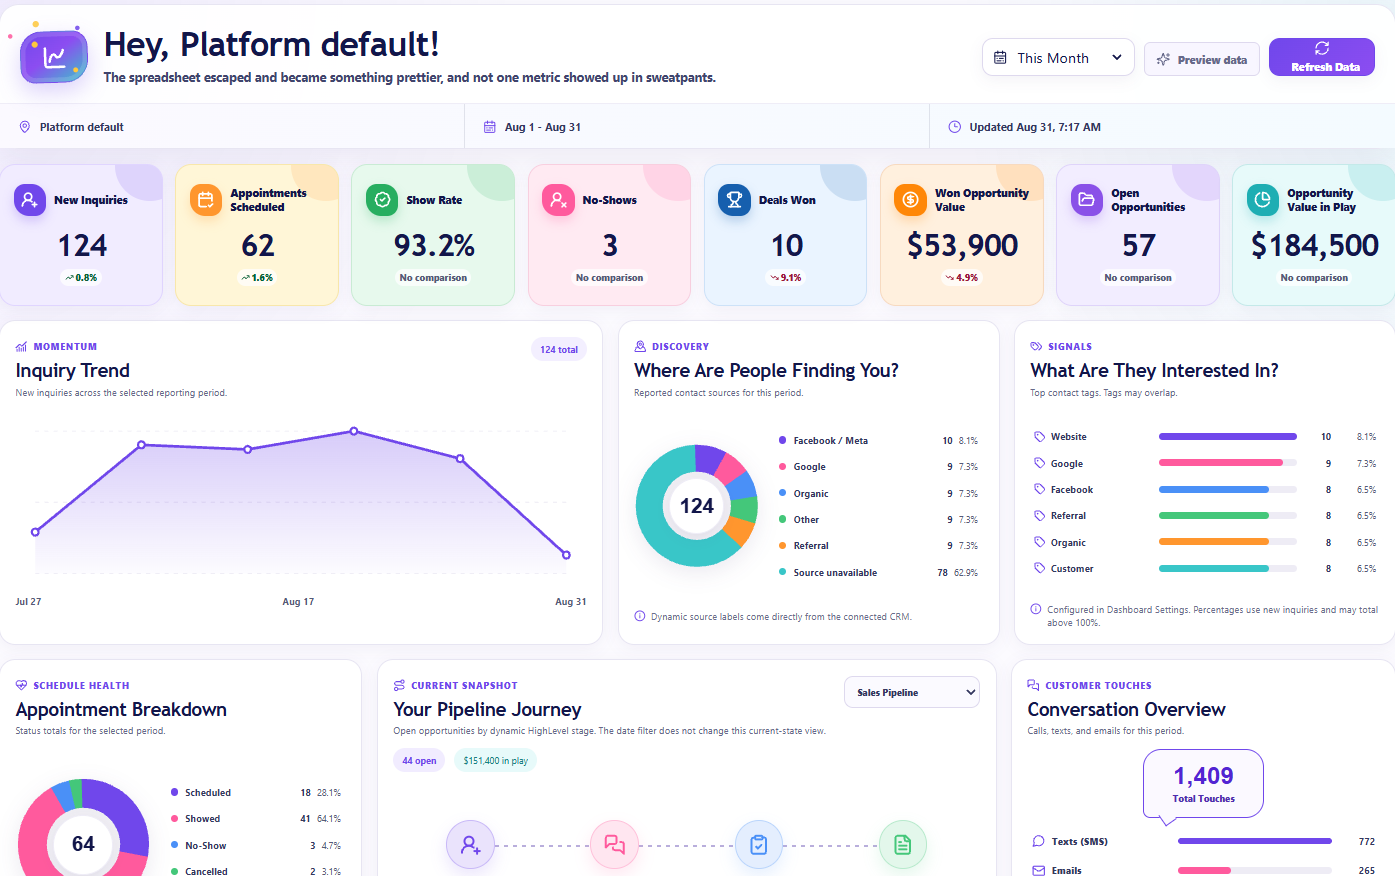
In this Creative Pop preview, the source panel has a total of 124. Facebook / Meta accounts for ten, while Source unavailable accounts for 78. The missing portion is the biggest part of the picture. That deserves more attention than arguing over which smaller colored slice is ahead.
Unavailable does not tell you which channel brought those people in. It tells you the displayed breakdown does not have a usable source classification for them. Do not quietly rename that group Direct, Organic, or Referral to make the report look more complete.
Start with a few underlying contact records. Check the stored source, the available attribution, and how the contact entered the CRM. Was it a form, an import, a manual addition, or an integration? A blank value is a reason to investigate, not proof of one particular tracking failure.
Agency Dash Pro presents the source information available to its reporting layer; it is not a time machine that reconstructs missing browsing history. When comparing it with another report, check which source field or fallback that view uses, as well as the period and contact group.
Tags can overlap, and that is perfectly normal
Now look at the panel beside the source chart. It says Top contact tags. May overlap. That small sentence is doing a very useful job.
A contact can carry several tags. Those tags might describe an interest, a workflow step, a service, or a category someone created months ago. A tag called Facebook is still a tag. Its name alone does not make it a verified advertising touchpoint.
Creative Pop’s preview shows Website, Google, Facebook, Referral, Organic, and Customer as tag labels. Read them as the selected contact-tag view, not as six mutually exclusive acquisition channels. Because contacts can appear in more than one group, tag percentages do not have to add up to 100%.
Before showing this panel to a client, agree on what the selected tags mean. If the question is which service people are interested in, show tags that actually describe those services. If the question is traffic attribution, use a report designed for that question instead.
More contacts does not automatically mean better marketing
A source chart answers a volume question. It does not, by itself, tell you whether those contacts were qualified, booked, attended, bought, or paid. A larger bar is not the same as a healthier business.
Use the inquiry trend to see whether fresh interest is growing or slowing. Then ask what happened after the inquiry. Did the team follow up? Did appointments happen? Were opportunities marked won consistently? Our guide to seven client dashboard metrics covers those next questions.
Be careful with ROI language. A contact-source breakdown alone does not include the spend and properly attributed business results needed to calculate return on investment. You can say a source brought in more recorded contacts. You cannot jump from that to it being the most profitable channel.
Give each report one clear job
You do not need to force every marketing question into one donut. HighLevel supports grouping Contacts widgets by Source, as described in its contact-source grouping announcement. That is useful for a source-label breakdown. It is not the same task as analyzing a first or latest attribution touchpoint.
For a native attribution widget, choose a supported Contact or Opportunity widget and decide whether First Attribution or Latest Attribution matches your question. Confirm the records contain the relevant data before filtering by a captured UTM value. A filter cannot supply campaign information that was never captured.
For a curated client reporting dashboard, choose a layout that makes the overview easy to understand, then explain the scope of its panels. The point of a polished screen is to make the reporting clearer, not to make every chart sound like a full attribution platform.
Test the intake, then make the reporting conversation simple
Pick one intake path you actually use and run a controlled test with a clearly labeled test contact. Check the resulting contact’s Source and attribution separately. For HighLevel forms and surveys, the documented source URL parameter can override the Source configured in the builder; it is not the same parameter as utm_source. Verify the saved result rather than assuming the link did what you intended.
Then look for inconsistent naming. If your team intends Meta, Facebook, and Facebook Ads to mean one reporting category, document that rule before changing records or automations. Do not overwrite historical source values just to make a chart tidier. Sometimes labels that look similar really do represent different intake paths.
Once the reporting data refreshes, check the intended account, period, and panel again. A useful client explanation might be: this chart shows the source labels available for this period, this portion is unclassified, and these tags describe separate categories that can overlap.
That is not the fanciest sentence in the world. But it gives the client something they can actually use. The goal of a GoHighLevel lead source dashboard is not to make the donut look impressive. It is to help everyone understand what is known, what is missing, and which question to ask next.