First, decide what is actually broken
You paste the dashboard code into HighLevel, save it, and get a blank rectangle. Or the dashboard appears, but it is squeezed into a box roughly the size of a business card. Or it looks great, except the numbers are not the ones you expected.
Those are three different problems. A page that does not load needs a different check from a page that loads but has no reporting data. Before replacing code or reconnecting anything, write down which one you are seeing: blank content, clipped content, an access message, or unexpected numbers.
This checklist is for an external dashboard displayed inside HighLevel. We will use Agency Dash Pro examples, but the first few checks apply to other embedded reporting pages too. Every dashboard image here is approved preview data, not evidence from a live client account.
Put the right thing in the right embed field
Start with the boring check. It is often the useful one. HighLevel’s embed instructions describe this route: open the dashboard in edit mode, select Elements, choose Embed, and configure the element. The URL option takes a full web address. The IFRAME option takes the full iframe snippet. Save the element after making the change.
If you copied a complete iframe from Agency Dash Pro, use the iframe input rather than pasting that whole snippet into a URL-only field. If you chose URL mode, enter the dashboard’s actual embed destination, not the workspace sign-in page or a template screenshot.
Use the code generated for the intended connected account. Avoid retyping it or copying a shortened version from a message. If your installation uses a HighLevel custom value, confirm that value is populated for this client account. A reusable placeholder still needs the correct account-specific destination behind it.
If you are starting from scratch rather than fixing an existing installation, our setup overview explains the connection, template selection, and embedding workflow.
Open the intended destination outside the widget
As an authorized account manager, open the embed destination in a separate browser tab. Keep it private: do not post an account-specific dashboard link in a public forum. You are checking whether the destination itself loads, not sharing access to it.
If it also fails there, investigate the destination, source state, and any access message first. Making the HighLevel widget taller will not repair a missing page or an unavailable reporting source. If it works directly but not inside HighLevel, you have narrowed the question to the embedded context.
One possible cause is a framing restriction. A page can allow direct visits while limiting which sites may embed it; MDN’s frame-ancestors reference explains that browser rule. That is a possibility to verify, not a diagnosis of every blank iframe. Record any browser error and ask the provider to investigate. Do not disable browser security or strip protective headers as a workaround.
Give the dashboard enough room to work
If the header and charts appear but the page feels chopped off, the embed may be working perfectly well inside an unhelpfully small container. Check the HighLevel widget’s width and height, then the dimensions in the generated iframe if your installation uses one.
HighLevel’s widget resizing guide describes adjusting the widget from its corners in edit mode and saving the layout. Give a full reporting dashboard enough room for its cards, labels, and controls. Then leave edit mode and look at the saved result.
Do not try to cure clipping by shrinking the whole page until the labels become unreadable. Check both the surrounding CRM page and the embedded page for scrollbars. A little vertical scrolling can be normal; a narrow frame that hides half the controls is not a finished client experience.
Test a smaller screen too. A dashboard that looks comfortable on your large monitor can feel very different inside a narrower CRM window. There is no single widget height that is right for every template and screen.
If the page loads, check the account and the view
Once you can see the dashboard, stop treating every unexpected number as an iframe problem. Confirm that the embed belongs to the client account you meant to connect, then check the selected reporting period and any available calendar or pipeline controls.
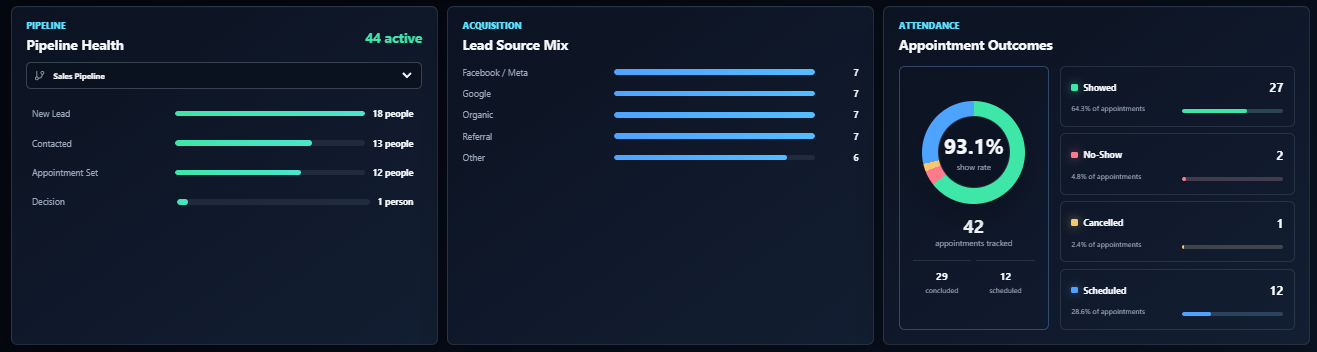
The flagship preview below has Sales Pipeline selected in its Pipeline Health panel. That is useful context. If you are comparing it with a different pipeline in HighLevel, the mismatch does not tell you the embed failed. It tells you to compare the same view before comparing totals.
Also distinguish an empty report from a broken page. A period with no matching records, an initial reporting update that has not completed, and an unhealthy connection need different follow-up. Read the status information before disconnecting an account or changing its assignment.
Separate preview data from a fresh reporting update
A dashboard that renders successfully is not, by itself, proof that you are seeing the intended account’s current data. Check whether you are looking at a preview, then verify the reporting period and update information against the actual account you are authorized to manage.
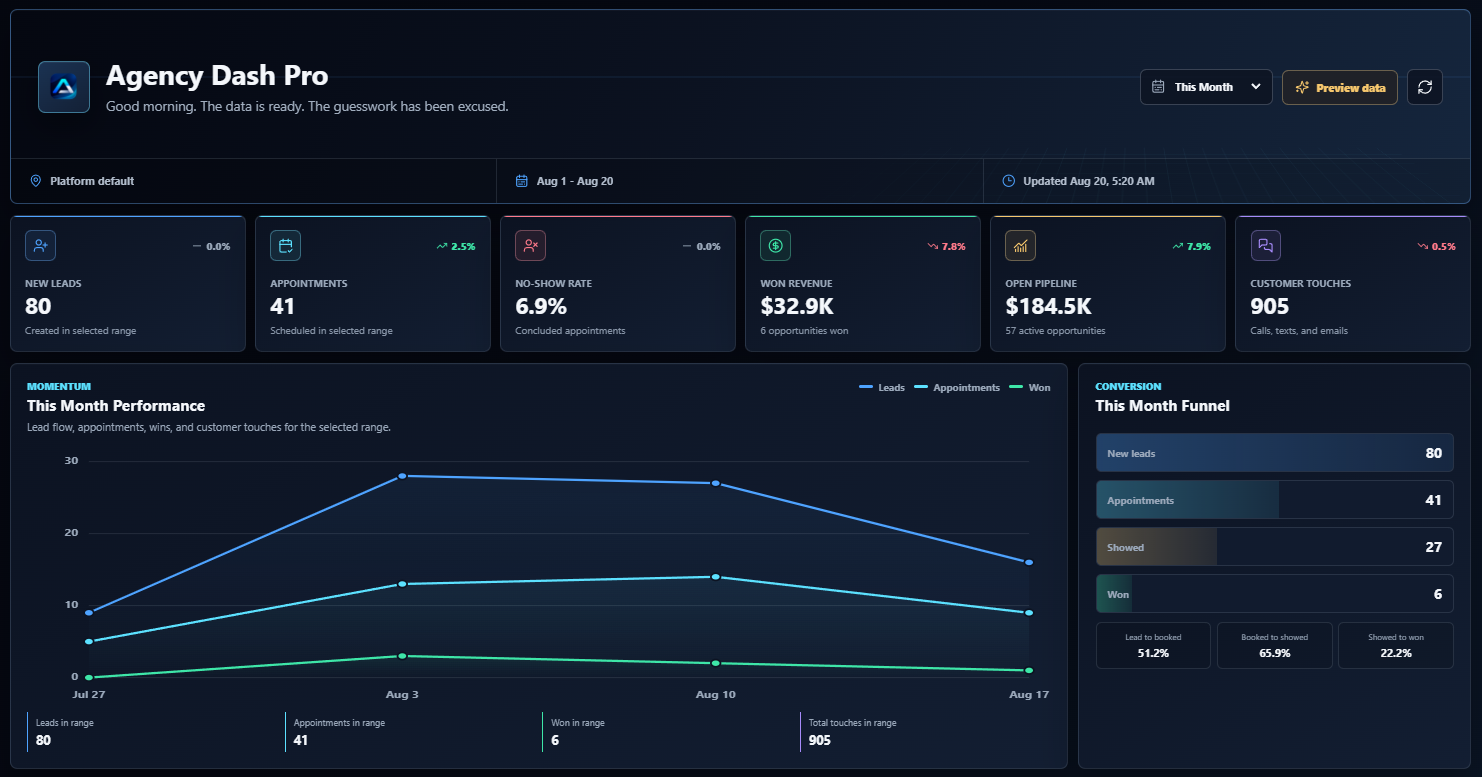
The approved flagship screenshot includes a Preview data control. That is why these images are labeled as samples. A polished set of charts is useful for choosing a design, but it is not a substitute for checking the connected reporting source during installation.
Agency Dash Pro publishes reporting snapshots through background refresh work. Reloading the CRM page and completing a new reporting update are different events. Check the latest update information before expecting a just-edited CRM record to appear. Do not assume every browser refresh makes a fresh HighLevel API request.
An update timestamp in a preview is not a current service-status reading. For a live installation, use the timestamp and connection information shown for that source. If the update is failing, record that separately from any layout issue.
Make one final pass as the intended viewer
Before handing the dashboard over, open the saved HighLevel dashboard using the intended viewer’s authorized access. Your own admin view is not the only experience that matters. Confirm the viewer can reach the page, read the labels, use the available controls, and scroll through the reporting panels.
Check that the account, template, and reporting period make sense together. If a permission problem appears, review the viewer’s legitimate access rather than giving everyone broader permissions just to make the screen load.
A useful final check is simple: can this person tell which account they are viewing, what period the numbers cover, and when the reporting last updated? Those details matter more than whether the dashboard happened to load once while you were editing it.
Send a specific problem, not a pile of secrets
If you still need help, describe the exact symptom: the direct destination fails, the page works only outside HighLevel, the widget clips its content, or the report loads with unexpected data. Include the browser, approximate time, and a redacted screenshot that does not expose client records.
Use the support page for the current support address and help categories. Do not email passwords, OAuth tokens, Private Integration Tokens, client secrets, full CRM exports, or an unredacted embed URL that may contain an access key. A safe description of the problem is a better starting point than a credential dump.
You should not have to rebuild the entire dashboard to investigate one blank box. Check the destination, input type, available space, reporting source, and viewer in that order. Each check removes a little guesswork, which is usually how the fix becomes obvious.